FLOVID-19
This page contains some data visualization of COVID-19 in Florida. Last update: 2021-04-06 14:00:09.
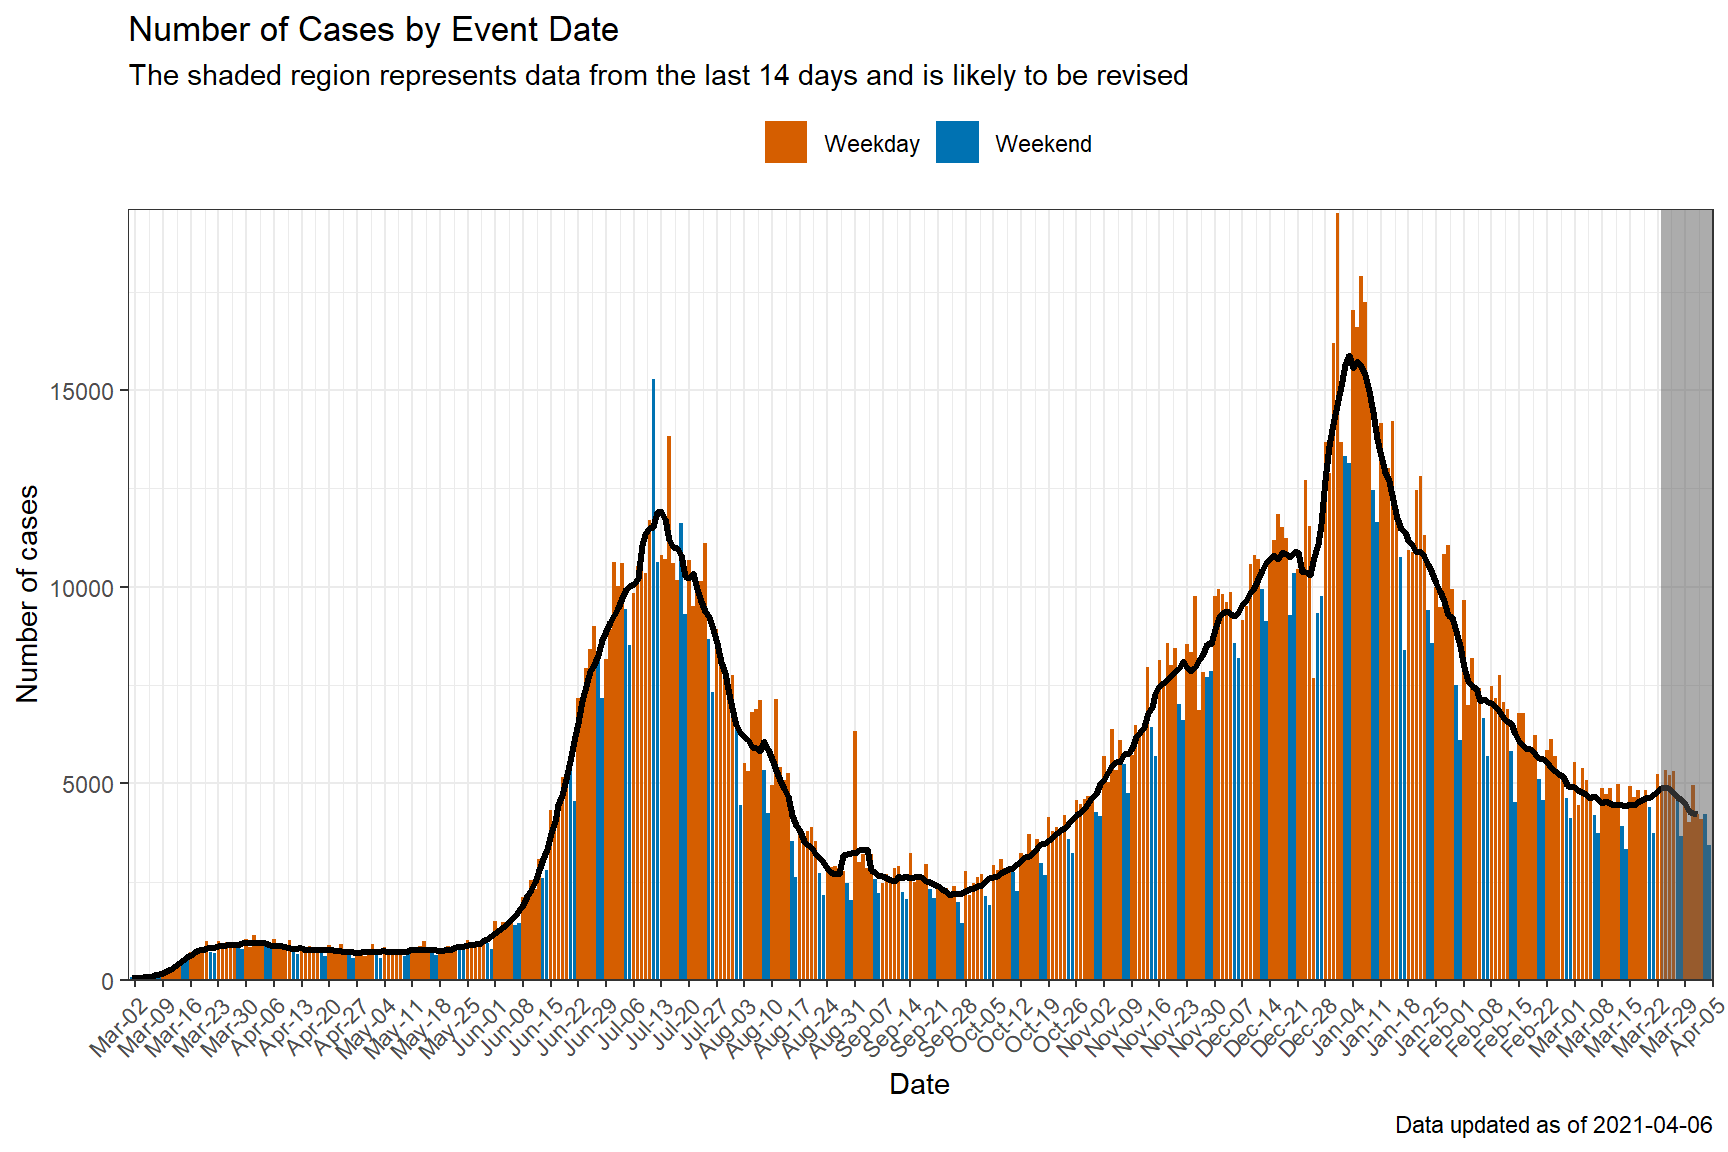
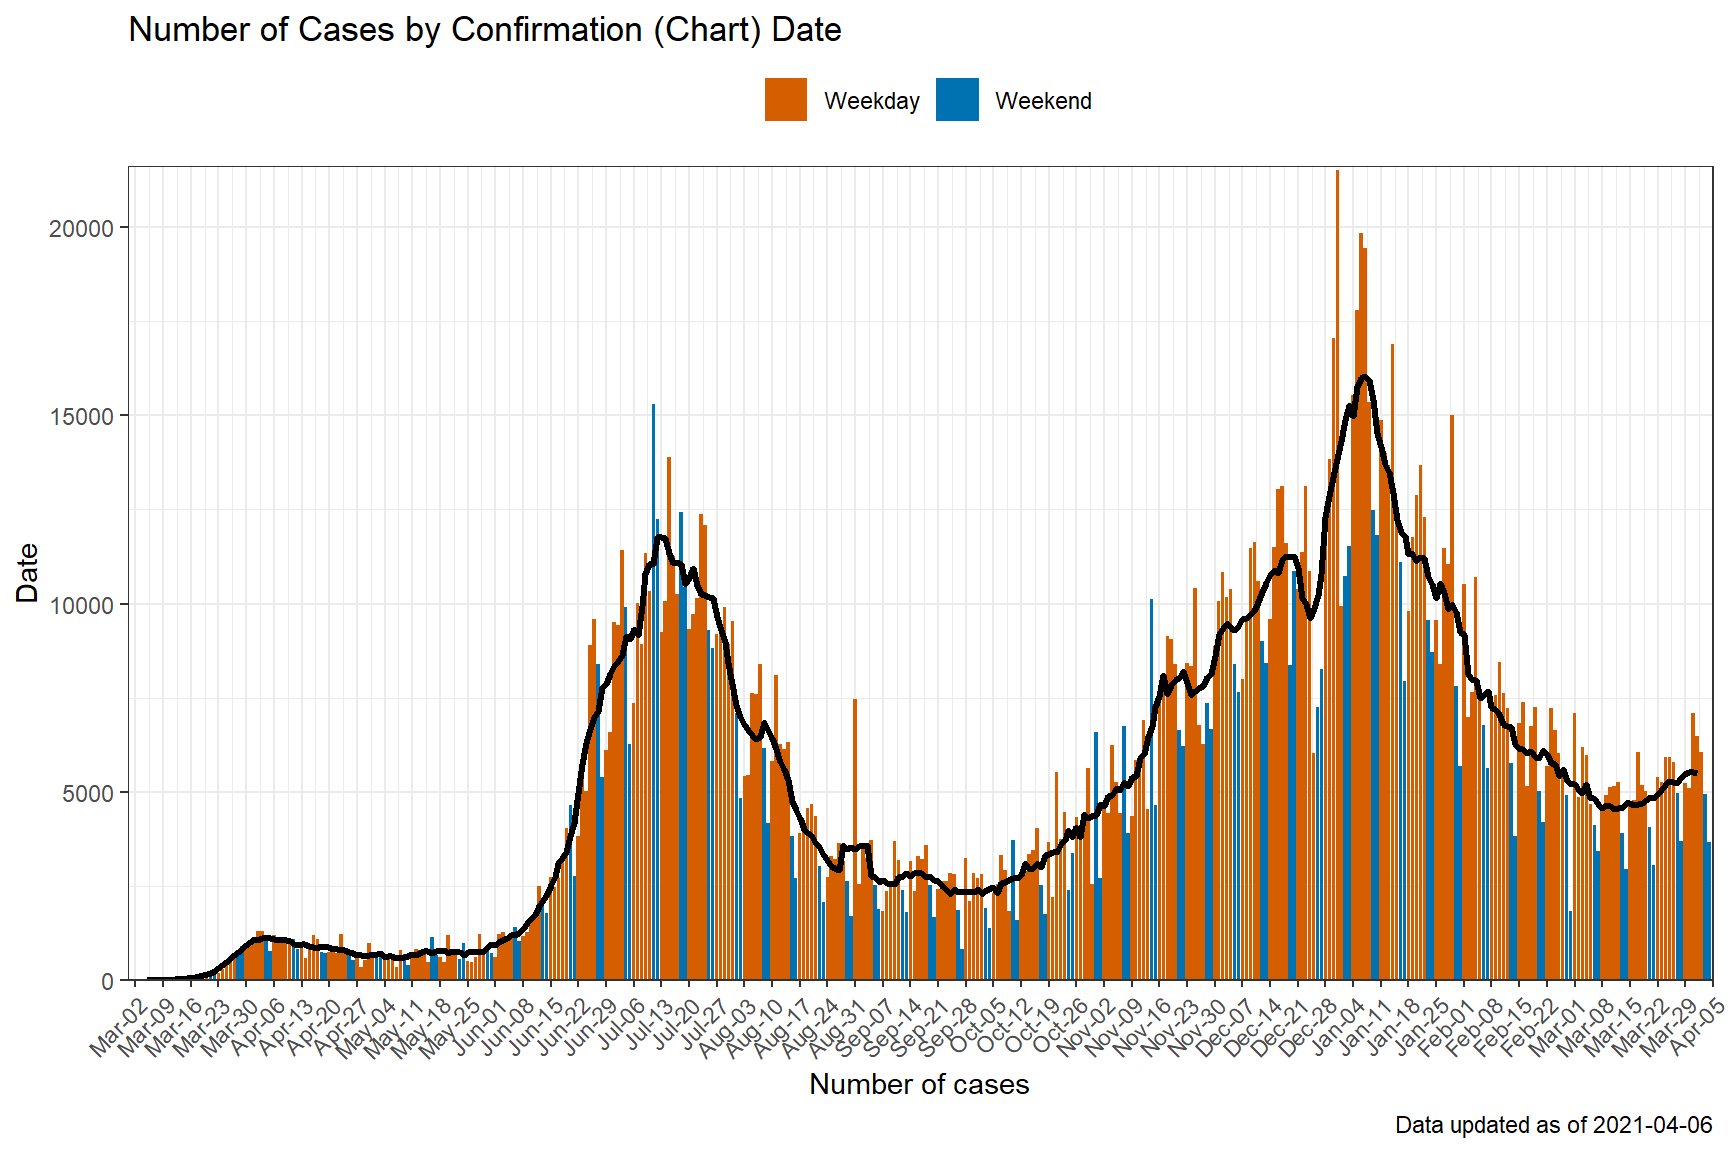
The “Event Date” of COVID-19 Cases is likely the day when a patient initiated the testing process, whereas the “Chart Date” seems to be when the test result confirm the patient is SARS-CoV-2 positive. The “Event Date” chart seems to yield better visualization in terms of understanding the pandemic in Florida than that of “Chart Date”. The downside is that the median time between “Chart Date” and “Event Date” is currently hovering around 4 days – The number of cases per event date is likely to be incomplete for about two weeks.
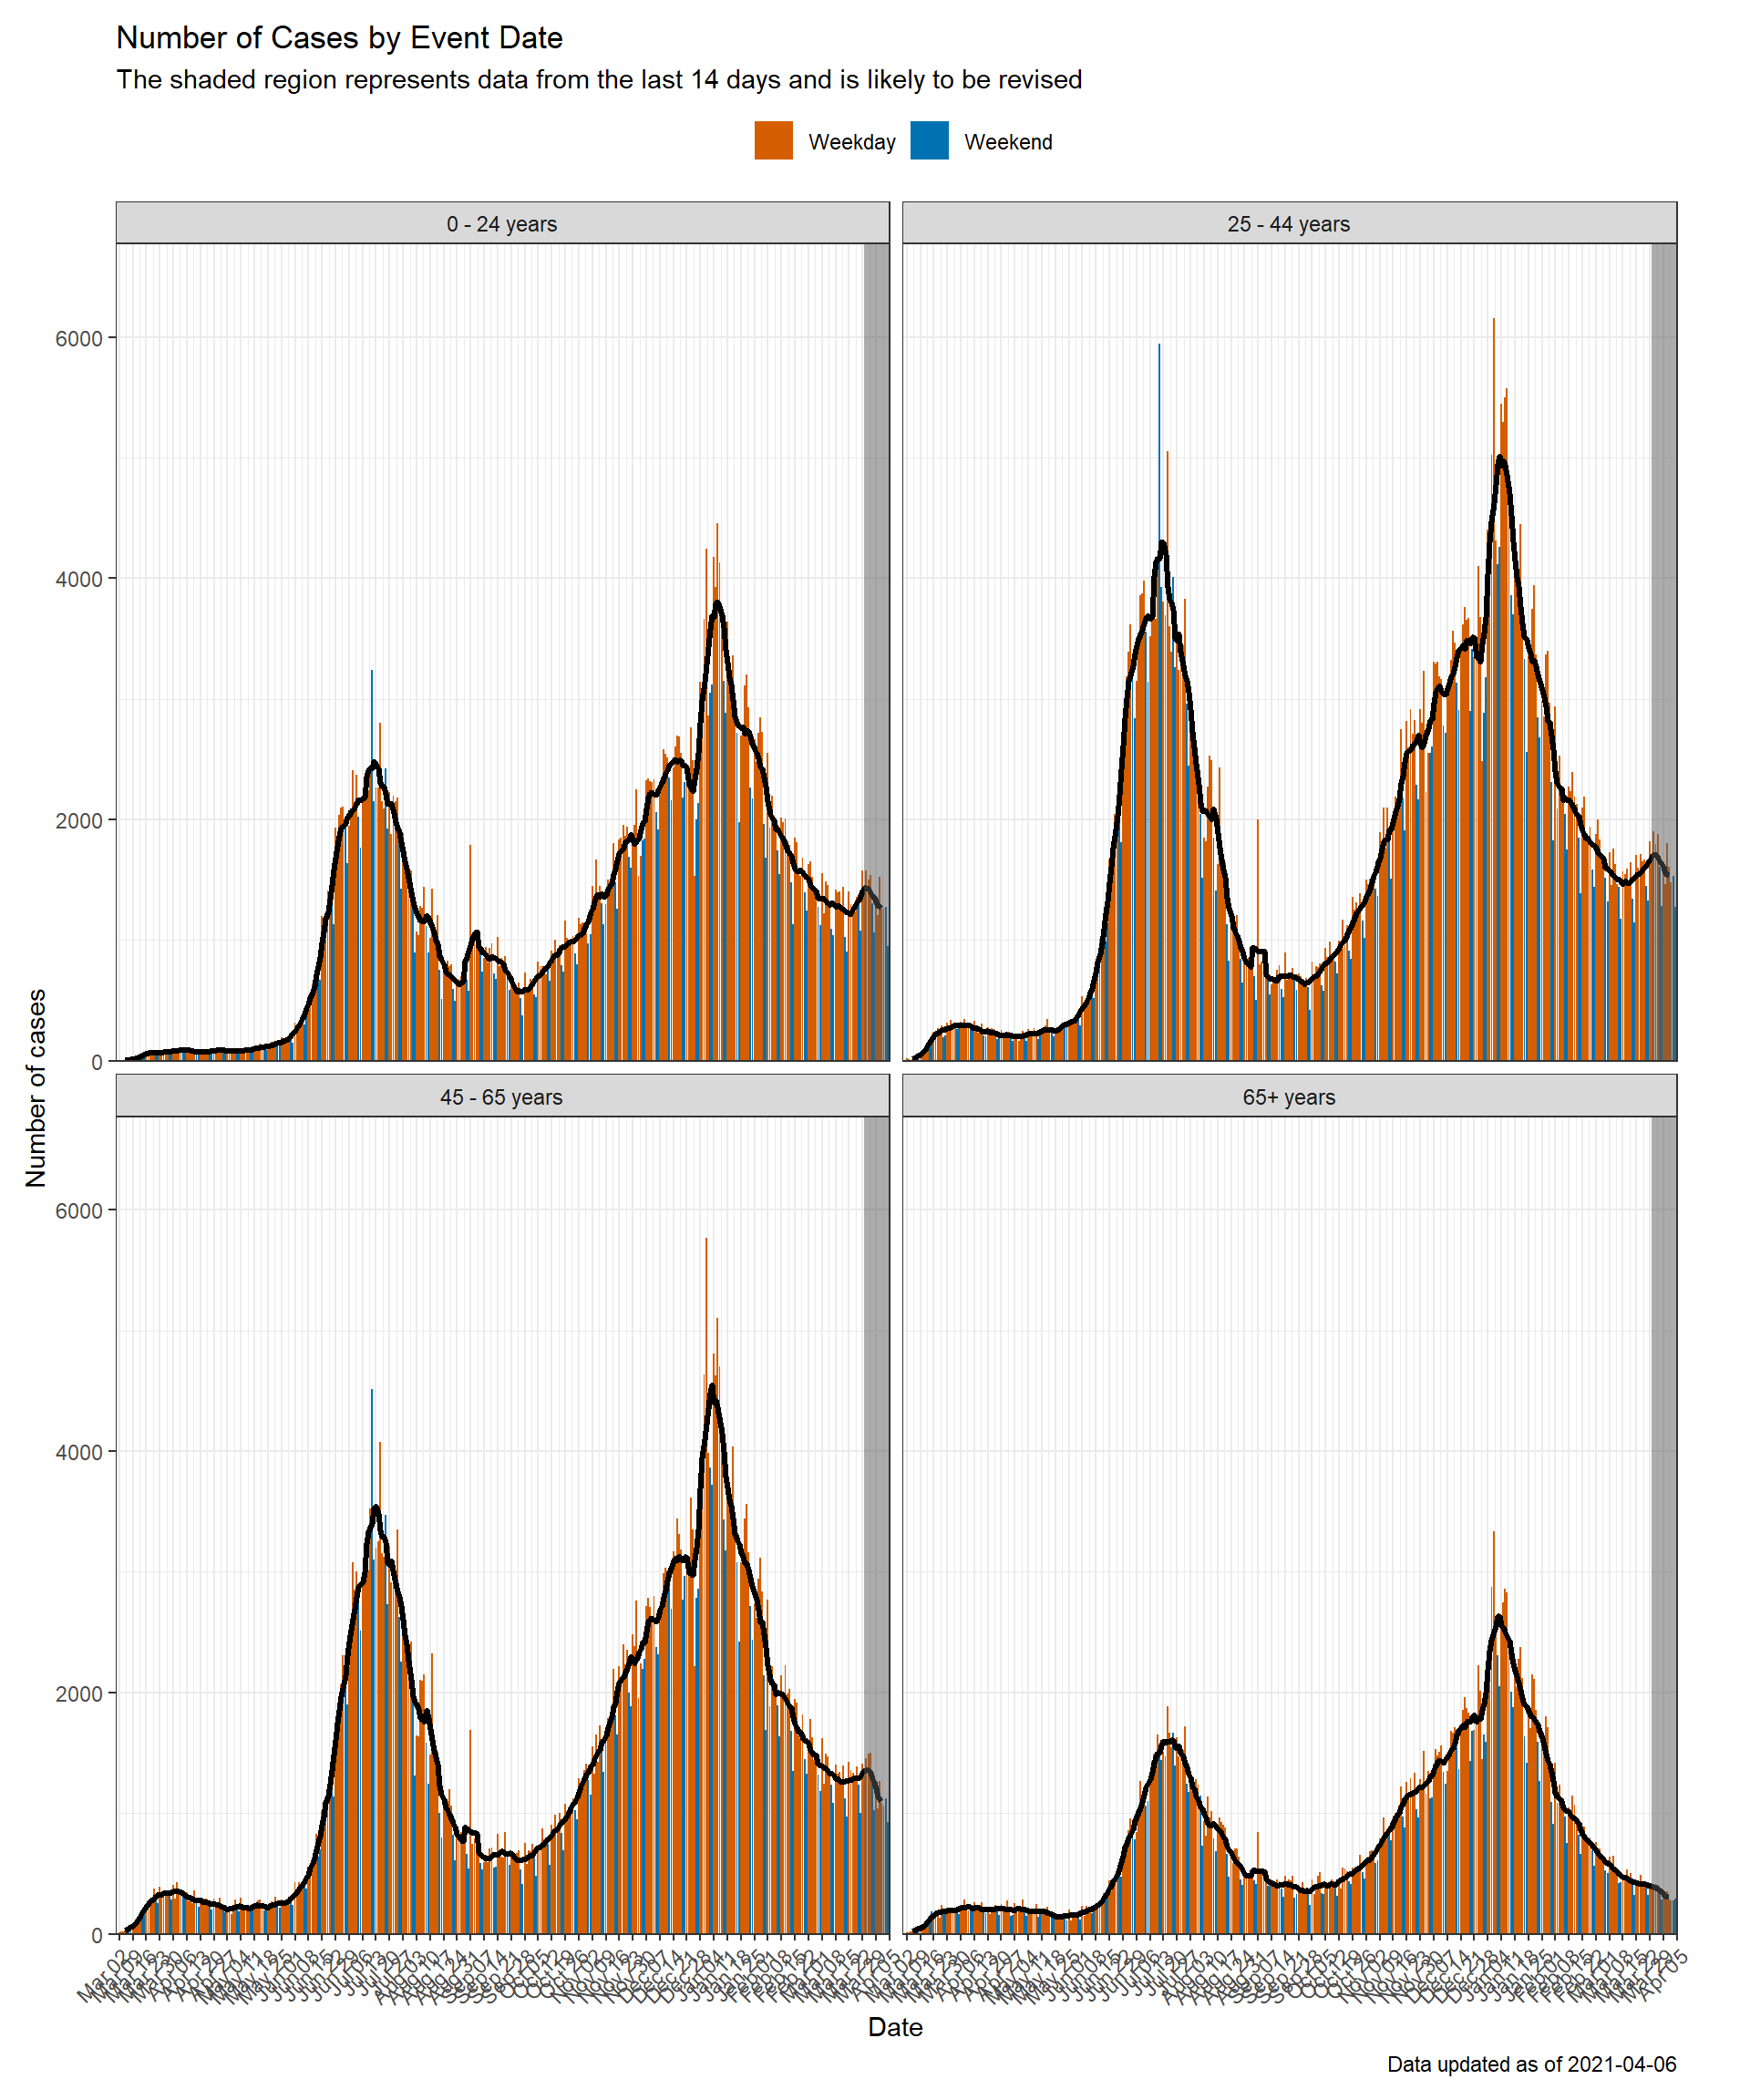
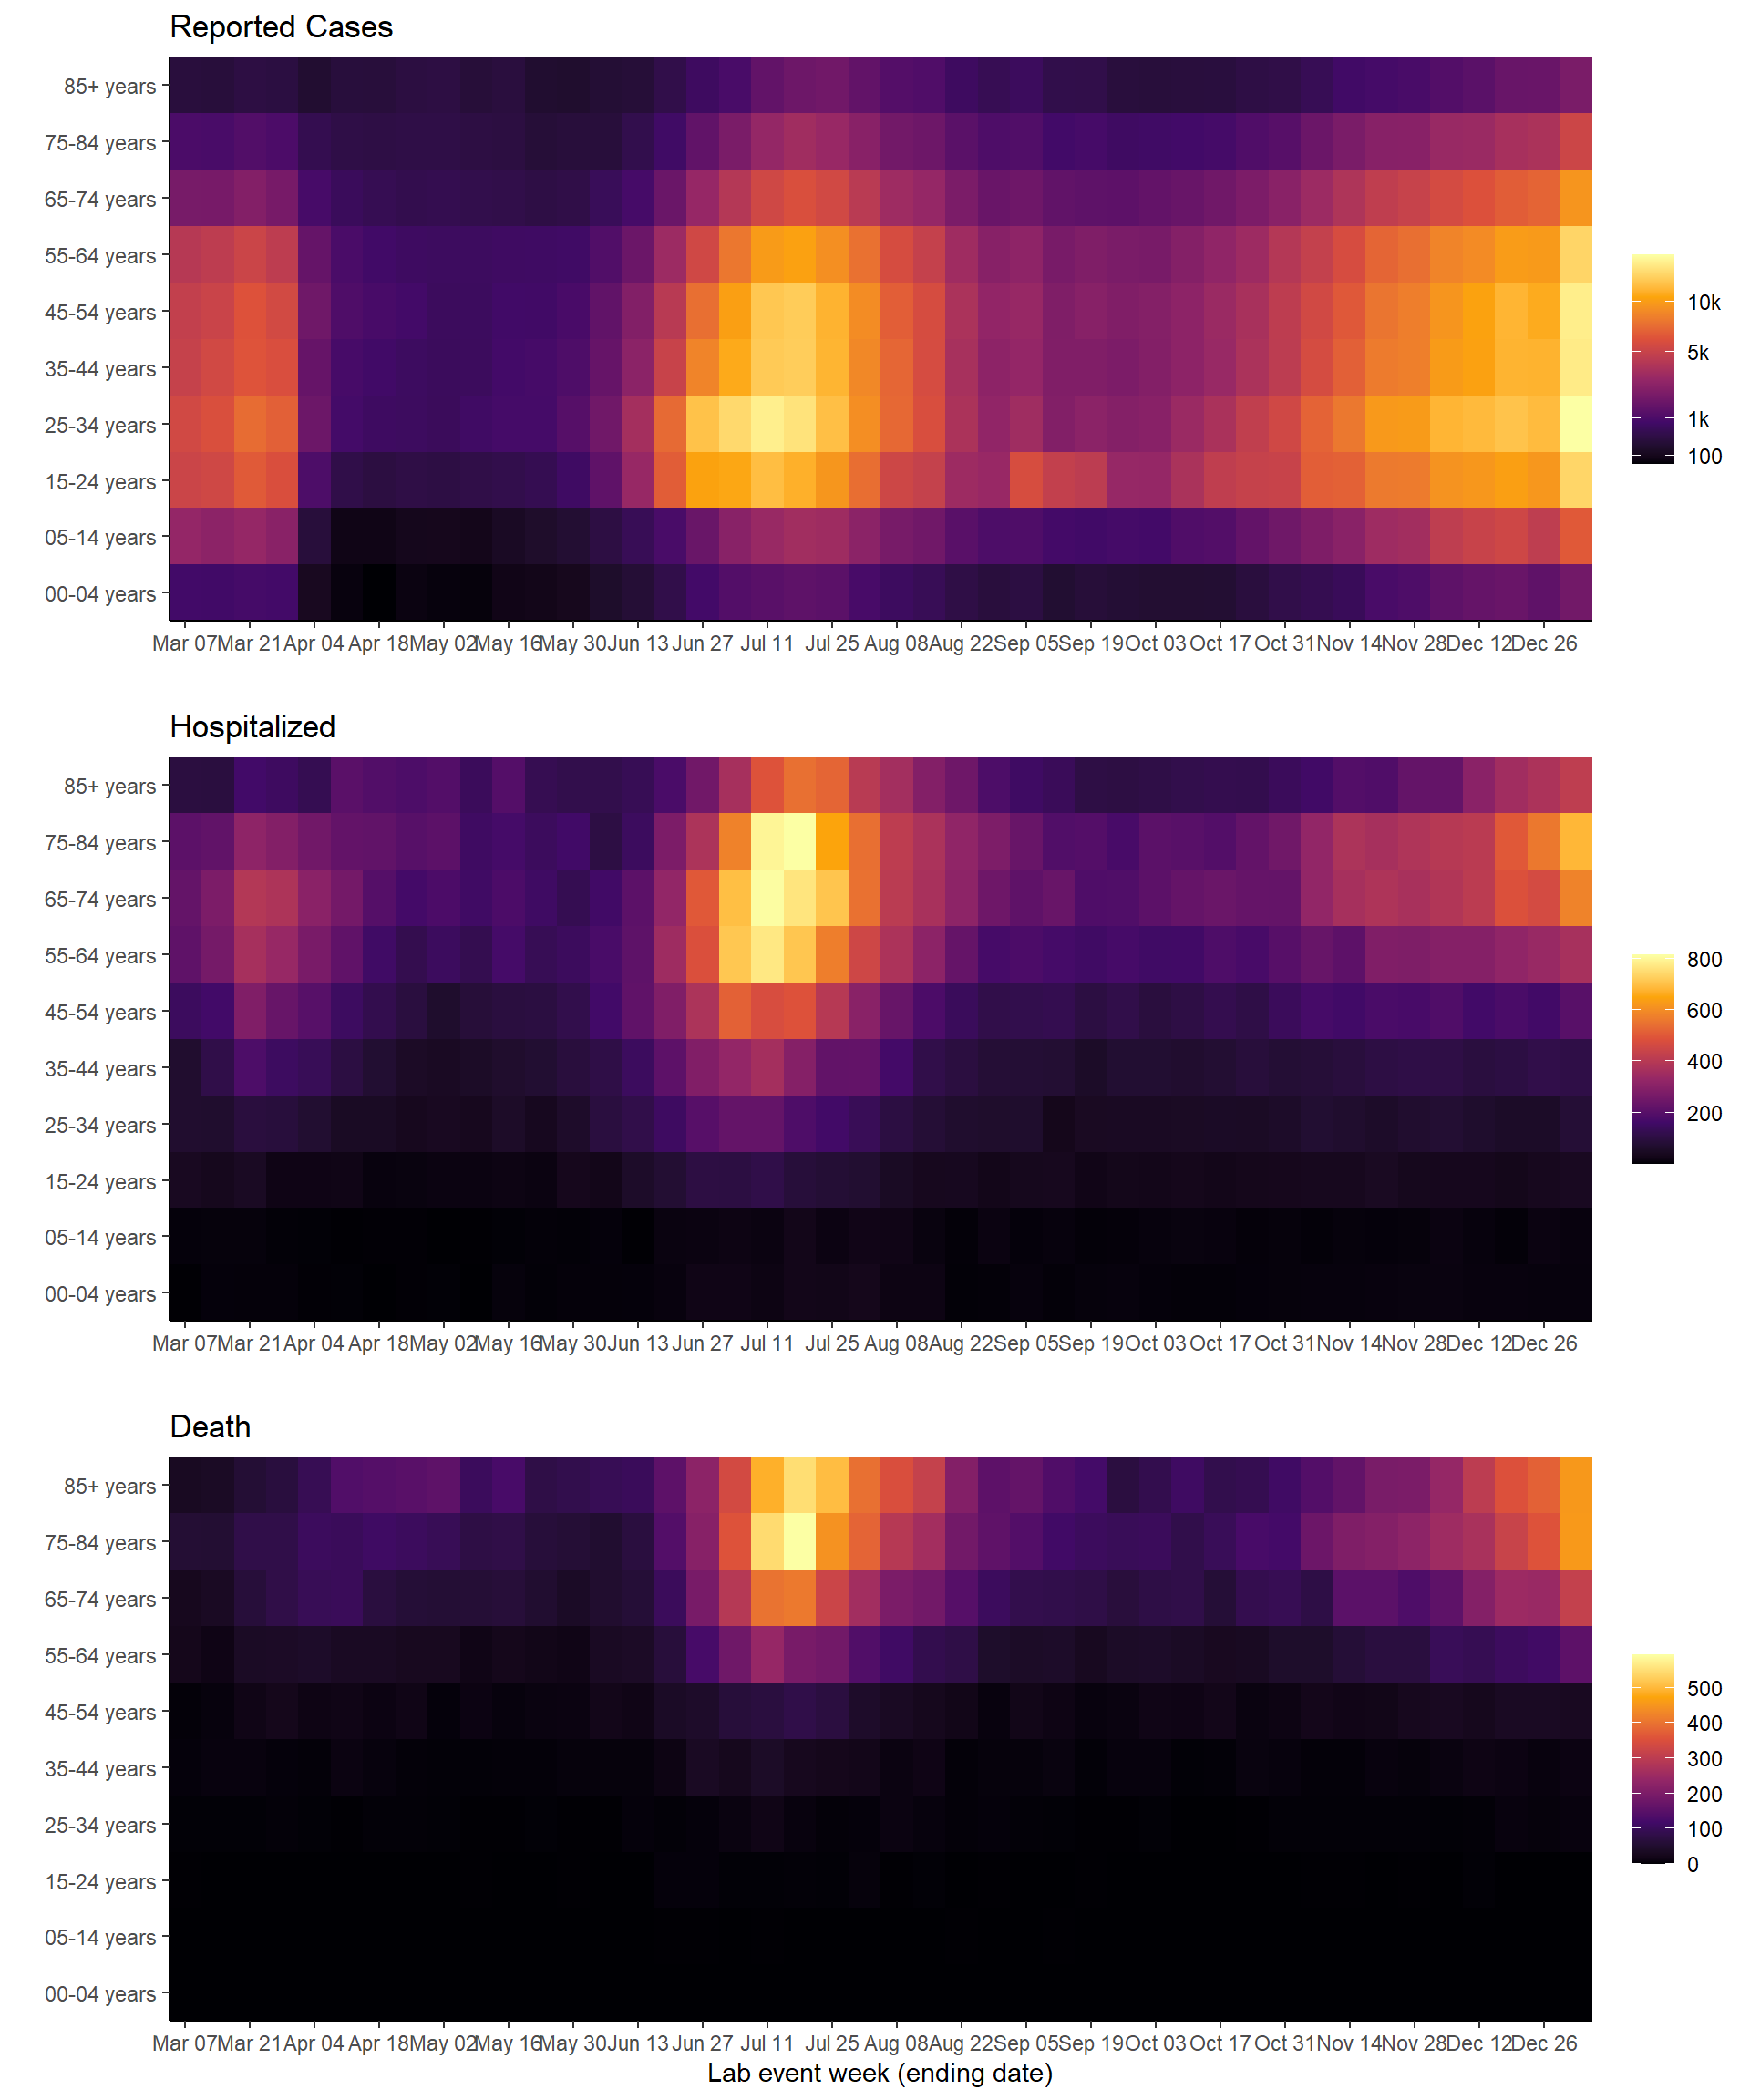
Cases by age group
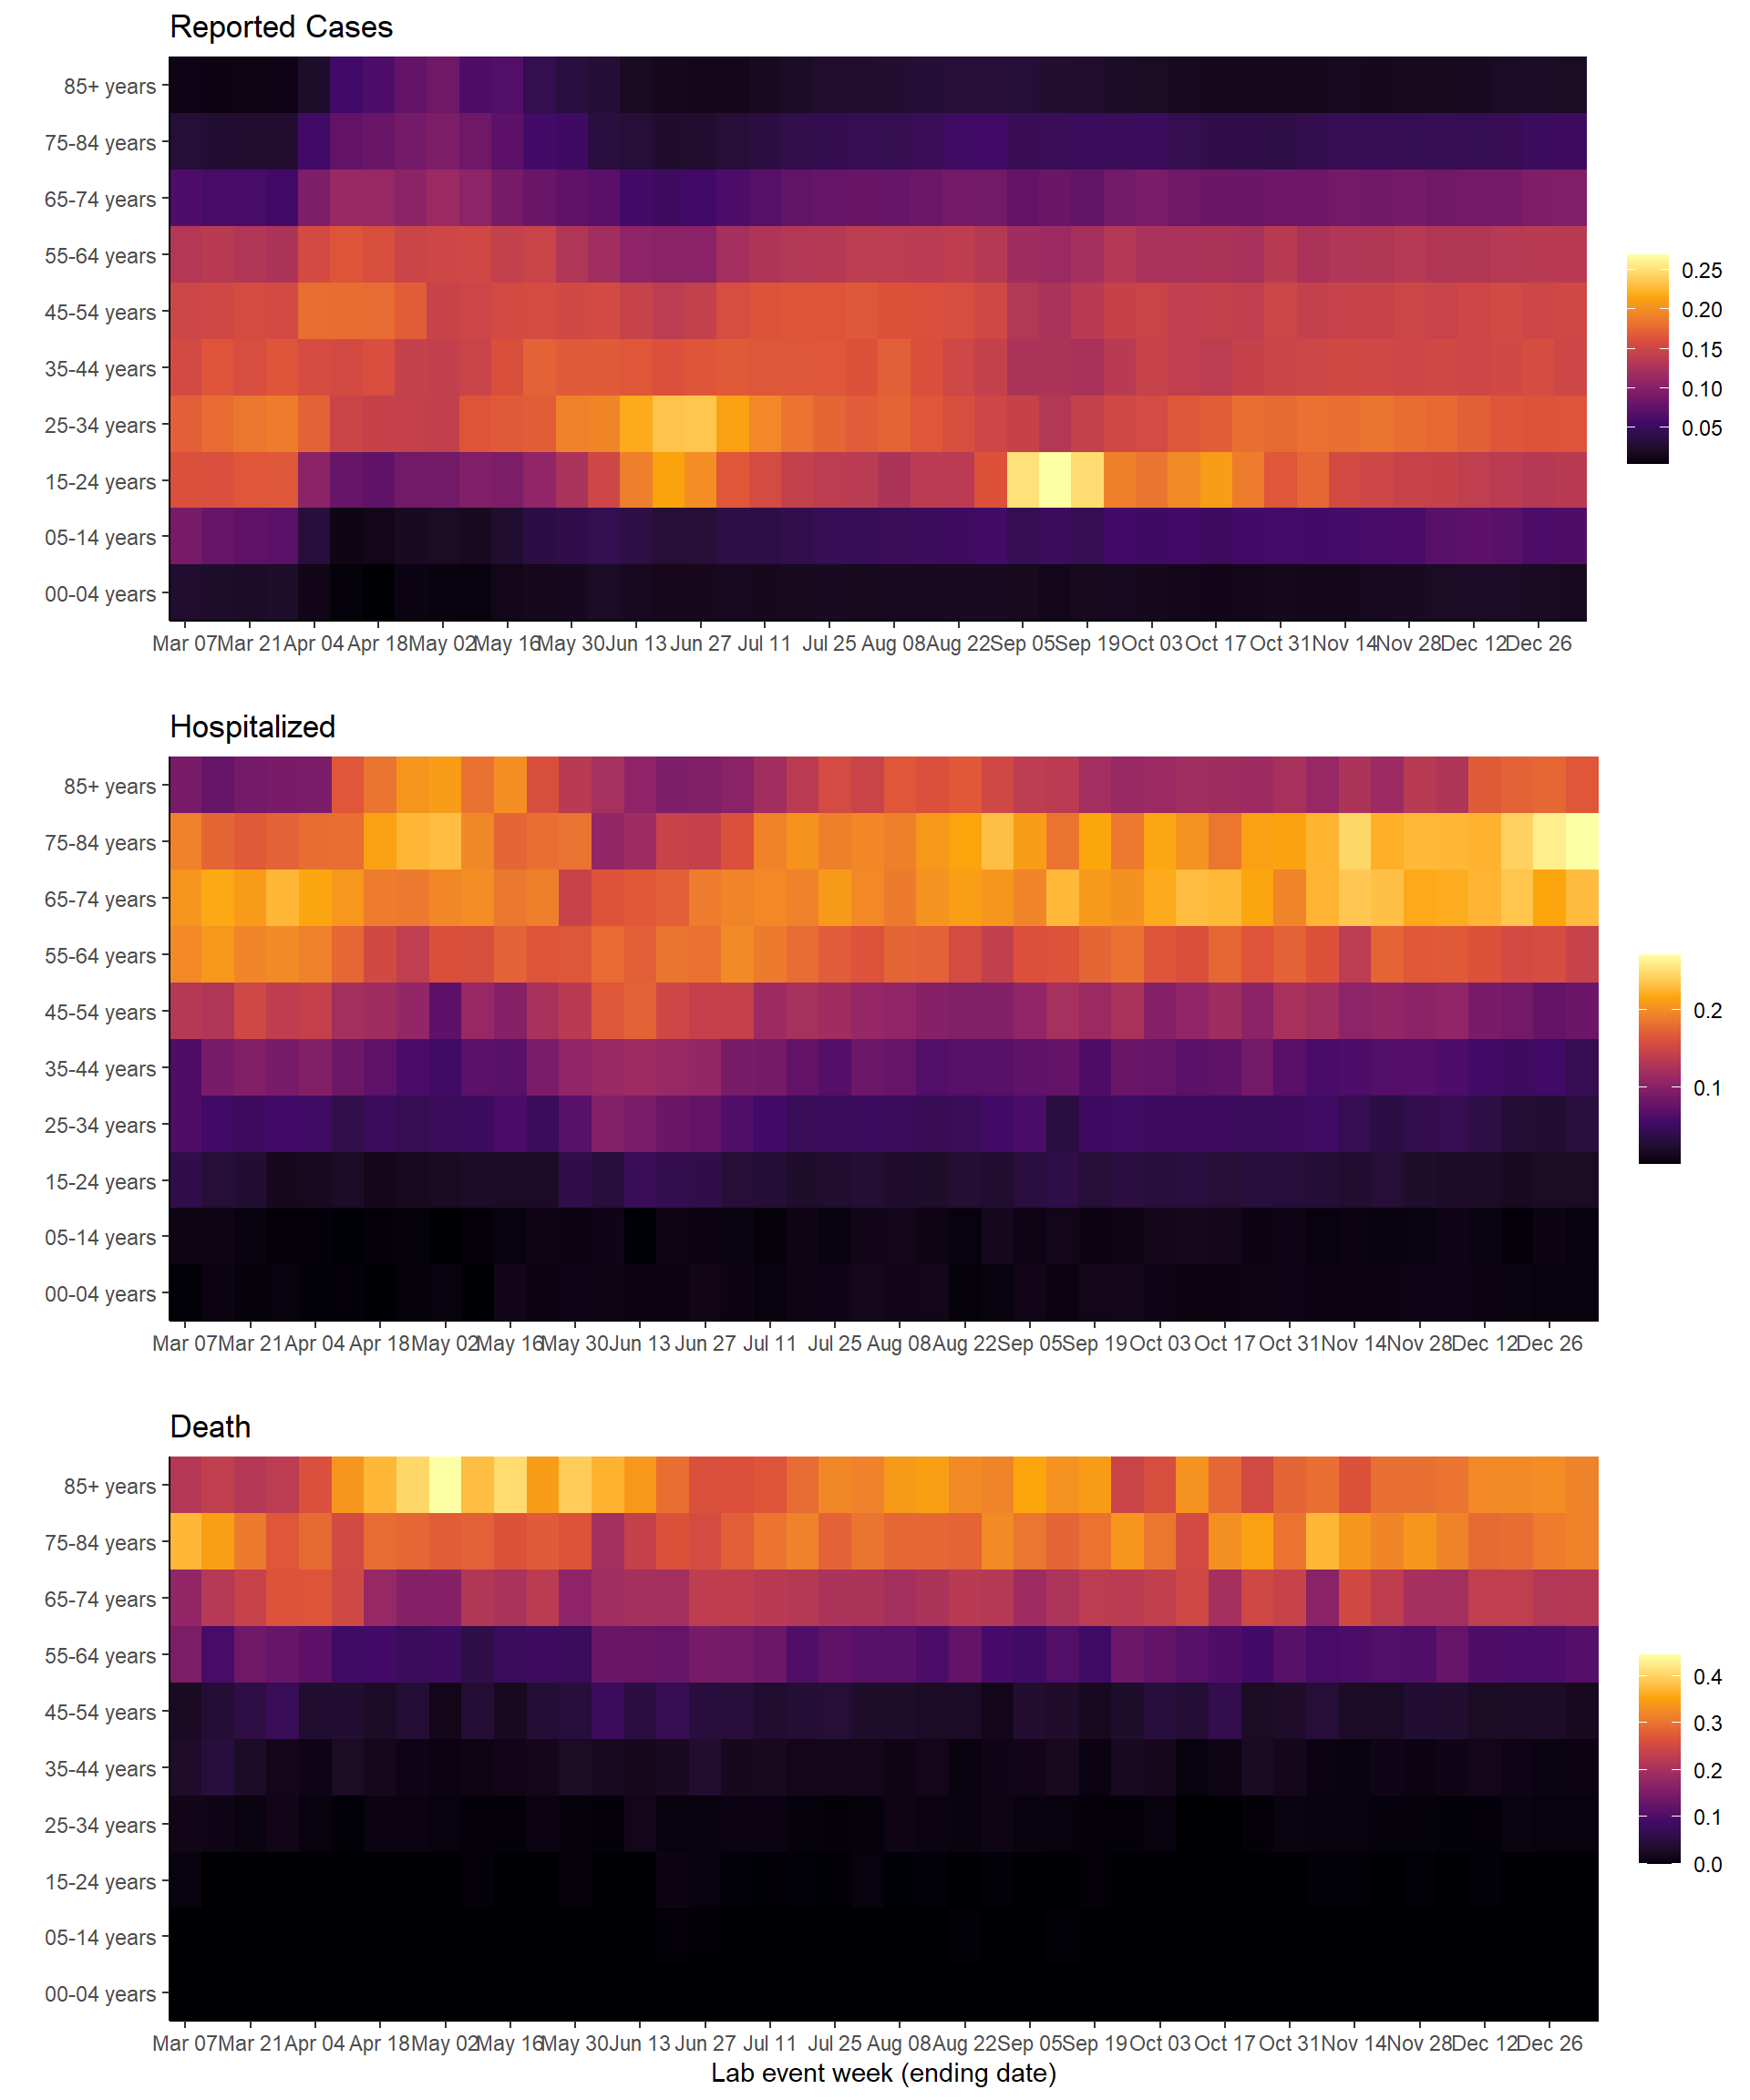
Inspired by the “heat map” by age concept that’s been floated around the internet, here are the heat maps of reported cases, hospitalized and death of COVID-19 in Florida. First by count:
Here’s by proportions:
Finally, the bar-line chart that I used initially: